Grafana for homelab monitoring—with mTLS!

Carl Tashian
Now that I have a Tiny Certificate Authority in my homelab, I've started putting it to good use by securing as many local endpoints as I can with mutual TLS authentication. With mutual TLS (mTLS), both client and server authenticate to one another with certificates. Servers will only accept connections from clients that can offer certificates issued by my CA.
In this tutorial I'm going to set up centralized logging and monitoring for my nodes using Grafana, Prometheus, and Loki. Agents on each host (node_exporter and Promtail) will send monitoring data, systemd logs, and Docker container logs to Prometheus and Loki from all of the nodes in my homelab.
Once we have all of this data aggregated, we can use some excellent tools in Grafana:
- The node_exporter dashboard, to monitor node hardware and resource utilization
- The Explore UI, for browsing system & Docker logs
- And the alerting system in Grafana can be configured to send alerts to your phone via Telegram
Fair warning: This is a chunky project with a lot of steps. I'd suggest devoting a weekend afternoon to it.
Here's the setup:
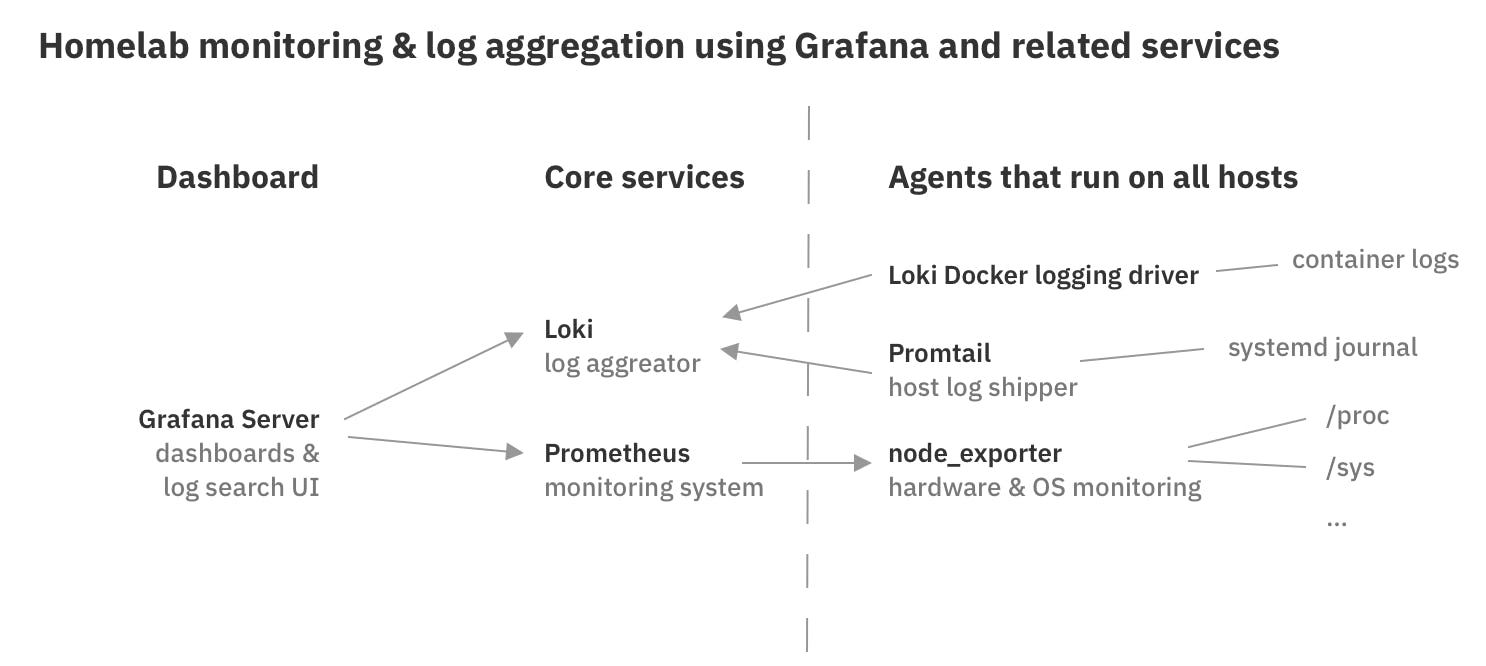
The arrows always point from a client to a server. Notice that Prometheus acts as a server in relation to Grafana, and a client in relation to node_exporter. So, it's going to need both a client and a server TLS certificate.
Here are the goals for this setup:
- Mutual TLS between all services. We really like mTLS! It's what we do! A lot of these services use HTTP and bind to 0.0.0.0 with no authentication by default, so we have our work cut out for us.
- Automated certificate management. There's three pieces to this:
- Automated Renewal of the TLS certificates. The
step-caserver issues short-lived (24 hour) TLS certificates by default, so we'll need a timer to renew them every 16 hours. - Automated Deployment of the renewed certificate (eg. restart a service, call an API, whatever is needed to get the certificate deployed).
- Health Checks in case either the renewal or the deployment fail. (I don't want a critical service interruption in my tiny homelab!)
- Automated Renewal of the TLS certificates. The
Before you begin
- You will need a
step-caCertificate Authority to issue certificates. You can build a tiny CA using a Raspberry Pi, or just follow our Getting Started guide to set one up on any machine. The CA should have an ACME provisioner configured—that's how we're going to get all of our certificates. ACME is the protocol used by Let's Encrypt.- In case you haven't already, configure your local system or web browser to trust your CA, so you don't get certificate warnings when accessing your Grafana dashboard. See
step certificate installfor details.
- In case you haven't already, configure your local system or web browser to trust your CA, so you don't get certificate warnings when accessing your Grafana dashboard. See
- DNS is important when working with certificates and ACME.
In my homelab, I've set up DNS CNAMEs for Grafana, Loki, and Prometheus (
grafana.internal,loki.internal, andprometheus.internal), so that I can issue server certificates with those DNS names on them.
Prerequisites for every host:
-
You'll need
stepandjqinstalled, and systemd version 219 or higher. -
You'll need to bootstrap your CA so you can get certificates.
Follow the directions in Accessing Your Certificate Authority to bootstrap your CA. When you're done, you should have your CA certificate in$HOME/.step/certs/root_ca.crt, and a$HOME/.step/config/defaults.jsonfile containing your CA connection details. -
Once you're bootstrapped your CA your own user, copy your
stepconfiguration directory to/etc/step-caso thatrootcan use it for automation:$ sudo cp -R ~/.step /etc/step-ca
-
Download our systemd certificate renewal templates.
We will leverage systemd timers to automatically renew the SSL certificates on every host, every day. For background on how this works, read our documentation section about renewal using systemd timers.
Download thecert-renewer@.serviceandcert-renewer@.timersystemd templates into/etc/systemd/system:$ curl -sSLf https://files.smallstep.com/cert-renewer%40.timer | sudo tee /etc/systemd/system/cert-renewer@.timer $ curl -sSLf https://files.smallstep.com/cert-renewer%40.service | sudo tee /etc/systemd/system/cert-renewer@.service $ sudo systemctl daemon-reload
(Take a look at these two files; you may need to adjust them if you have a newer version of systemd.)
The host is now prepped to use service-specific renewal timers.
Order of operations
We're going to do this from the bottom up:
- First we'll set up the data collection agents: node_exporter, Promtail, and Loki's Docker logging driver on a single target host.
- Then we'll set up Prometheus and Loki servers
- Finally, we'll set up and configure the Grafana server
Host setup
Repeat this host setup process for every host you want to monitor. Every host will need to run node_exporter, Promtail, and Loki's Docker logging driver. The host we're setting up in this example is calledlando.internal; change the hostname in the commands below to fit your setup.
node_exporter
Install It
node_exporter producers machine-level metrics for Prometheus. It's a single binary. Download it for your platform, expand it, and copy it into/usr/bin.
Configure TLS
Now create a/etc/node_exporter/web-config.yml configuration file, with the following contents:
Mutual TLS happens when we have certificate authentication in both directions. Here's what these TLS settings mean:
- Authenticating node_exporter to Prometheus: The
cert_fileandkey_fileare the server certificate and key that node_exporter will offer to Prometheus (which is a client, relative to node_exporter). Prometheus will refuse to connect if this certificate isn't valid. - Authenticating Prometheus to node_exporter: The client CA certificate (
client_ca_file) ensures that node_exporter will require Prometheus to offer a server certificate issued by the CA.
Get a certificate
Let's put our certificate files in place and create a service user that will run node_exporter (and, later, Promtail):
I'm using the ACME provisioner here, and I have a local DNS server for my .internal zone.
If you don't have a DNS zone for your homelab, or you have trouble using the ACME provisioner to get a certificate,
you can always use the password-based JWK provisioner instead.
Start node_exporter
Now we'll get node_exporter running with systemd, and have it start on system startup.
Runsystemctl edit --full --force node_exporter.service, and add the following contents:
Now start node_exporter with
systemctl enable --now node_exporter.
You should see from systemctl status node_exporter that it's running and TLS is enabled.
Automate Certificate Renewal
Now let's create a renewer for node_exporter:
Add the following configuration:
This tells the renewer which SSL certificate files to update for node_exporter.
Now we'll enable the timer to renew the certificate every day:
The certificate will renew about every 16 hours. Check the journal for
cert-renewer@node_exporter.service, and the output of systemctl list-timers to make sure the timer and renewal is working properly:
Add a Renewal Health Check
It's helpful to know when certificate renewals aren't working properly. For this, we can use healthchecks.io.

Each of these renewal services we create on each host will need its own Healtchecks URL. If certificate renewal breaks for any reason, you can get a DM on Telegram from Healthchecks.
Once you have created a Healthchecks URL for node_exporter on this host, runsudo systemctl edit cert-renewer@node_exporter.service again and append the following line, filling in your own ping URL:
Finally, reload your systemd configuration with
systemctl daemon-reload.
Promtail
Promtail acts as a log agent on every host, gathering logs and sending them to Loki. Here, we'll configure it with to ship systemd journal logs to Loki.
Install it
Download Promtail from the releases page on GitHub and unzip it. Copy the binary to/usr/bin.
Configure TLS
Make a directory/etc/promtail and add our Promtail configuration (promtail.yml):
The only thing you'll need to change here is theserver: disable: true positions: filename: /tmp/positions.yaml clients: - url: https://loki.internal:3101/loki/api/v1/push tls_config: ca_file: /etc/promtail/root_ca.crt cert_file: /etc/promtail/promtail.crt key_file: /etc/promtail/promtail.key scrape_configs: - job_name: journal journal: max_age: 24h labels: job: systemd-journal relabel_configs: - source_labels: ['__journal__systemd_unit'] target_label: 'unit' - source_labels: ['__journal__systemd_priority_keyword'] target_label: 'priority' - source_labels: ['__journal__hostname'] target_label: 'host'
url.
It should point to the DNS name where you'll host your Loki instance.
(We'll set up Loki below.)
Get a Certificate
Now we'll make sure Promtail has the SSL certificate files it needs. We'll reuse theprometheus service user we already created above.
Run the following:
Start Promtail
We're doing the same thing here as we did for node_exporter.
Now we'll get Promtail running with systemd, and have it start on system startup. When we first start it, it will fail to connect to our Loki instance because it doesn't exist yet. That's OK for now.
We'll need a systemd service unit for Promtail. Runsudo systemctl edit --full --force promtail.service, and add the following:
Now run
sudo systemctl enable --now promtail.service
Automate Certificate Renewal
We're doing the same thing here as we did for node_exporter.
Runsudo systemctl edit cert-renewer@promtail.service and add the following:
Now we'll enable the timer:
Check the journal for
cert-renewer@promtail.service, and check the output of systemctl list-timers to make sure renewal is working properly.
Loki Docker Logging Driver
If your host uses Docker, the Loki Docker Logging Driver will ship all of your container logs to Loki.
Install It
Follow the directions from this page to install the Docker driver for Loki.
For my Raspberry Pi hosts, I needed to install the arm-v7 version of the driver:
Configure TLS
Edit the/etc/docker/daemon.json defaults to use the Loki driver:
Get a Client Certificate
Deploying a certificate to this Docker plugin is not straightforward. The filenames referenced in the above config are inside the plugin container, not on the host!
According to this issue, the easiest way to deploy the certificate files is to put them into/var/lib/docker/plugins/$PLUGIN_ID/roofts/. Where $PLUGIN_ID will be shown by running docker plugin inspect loki | jq -r '.[0].Id'.
Run the following:
Now restart Docker so it picks up its new configuration.
Automate Certificate Renewal
The renewal service is a bit trickier for the Loki Docker Driver, because we have to deploy the renewed certificate files to the container directory.
Runsudo systemctl edit cert-renewer@loki-docker-driver.service and add the following:
Now we'll enable the timer:
That's all for host setup.
Set up Core Services
Now let's move on to the core services. You'll want these on their own VM.
Loki
We'll start by setting up Loki, a log aggregation server & database.
Loki acts as a server to all of your hosts, receiving their logs, and a client to Grafana.
Install It
Loki is just a single binary. To run it, download the binary for your platform, and put it in/usr/bin.
Run systemctl edit --full --force loki.service, and add the following:
Unfortunately, Loki doesn't support mutual TLS yet. But, everything that will connect to Loki does support mutual TLS.
So, once we install Prometheus, we're going to put a reverse proxy in front of Loki and Prometheus, and add TLS in the proxy.
I made a special config (Gist) that binds Loki's HTTP listener to localhost only, instead of 0.0.0.0 (the default). You'll need aloki user, and the config file:
Prometheus
Prometheus is a monitoring system and database. It's a chunky piece of software and there are entire courses devoted to learning it. But, today we're just going to configure it to scrape our node_exporter targets.
Install It
Download Prometheus for your platform from the release page:
Here's a systemd unit file. Run
systemctl edit --full --force prometheus.service, and add the following:
Don't start the service quite yet; we still need to configure our targets (using file service discovery) and a client certificate.
Configure TLS (client-side)
Like Loki, Prometheus doesn't support TLS as a server. But it does support TLS as a client connecting to scrape targets like node_exporter. I've written a Prometheus config file (Gist) that sets TLS options. Let's put the config file into place, get a client certificate, and add a service user for Prometheus:
You'll need to change the$ curl -sSLf https://gist.githubusercontent.com/tashian/4e9ab9c5dcecc70946a9ae2a0e0044c3/raw/7679649a052f334900b467380566c58a6a8bfac5/prometheus.yml | sudo tee /etc/prometheus/prometheus.yml $ sudo mkdir /etc/prometheus/targets $ sudo tee /etc/prometheus/targets/nodes.json > /dev/null <<'EOF' [ { "labels": { "job": "nodes" }, "targets": [ "lando.internal:9100" ] } ] EOF $ sudo -E step ca certificate prometheus.internal /etc/prometheus/client.crt /etc/prometheus/client.key --provisioner acme ✔ Provisioner: acme (ACME) Using Standalone Mode HTTP challenge to validate prometheus.internal .. done! Waiting for Order to be 'ready' for finalization .. done! Finalizing Order .. done! ✔ Certificate: /etc/prometheus/client.crt ✔ Private Key: /etc/prometheus/client.key $ sudo -E step ca root /etc/prometheus/root_ca.crt $ sudo useradd --system --home /etc/prometheus --shell /bin/false prometheus $ sudo chown -R prometheus:prometheus /etc/prometheus /var/lib/prometheus $ sudo systemctl enable --now prometheus.service
"targets" list to list all of your node_exporter hosts.
Prometheus should now be running and scraping your node_explorer targets with mTLS.
And you can add additional hosts to the nodes.json targets list without restarting Prometheus.
Automate Certificate Renewal (client-side)
Runsudo systemctl edit cert-renewer@prometheus.service and add the following:
Now we'll enable the timer:
Configure TLS With Caddy (server-side)
Caddy is a web server and reverse proxy known for its automatic HTTPS support. It will get certificates from the CA using ACME, and it will renew them for us when needed.
Install Caddy using their installation instructions, which will create and start acaddy.service for us.
Now place the following in /etc/caddy/Caddyfile:
{ email carl@smallstep.com acme_ca https://ca.internal:4443/acme/acme/directory acme_ca_root /etc/caddy/root_ca.crt } # Loki https://loki.internal:3101 { reverse_proxy http://localhost:3100 tls { client_auth { trusted_ca_cert_file /etc/caddy/root_ca.crt } } } # Prometheus https://prometheus.internal:9091 { reverse_proxy http://localhost:9090 tls { client_auth { trusted_ca_cert_file /etc/caddy/root_ca.crt } } }
- Change the
acme_ca,email, and adjust the externally-facing Loki and Prometheus HTTPS URLs to match your setup. - Be sure to put the
root_ca.crtinto/etc/caddy, too. (sudo -E step ca root /etc/caddy/root_ca.crt) - Finally,
chown -R caddy:caddy /etc/caddyand restart Caddy.
sudo journalctl -fu caddy.service.
Once Caddy is up and running with certificates, it will authenticate all connecting clients to be sure they have certificates signed by the root CA, /etc/caddy/root_ca.crt.
There's a small security tradeoff here: Anyone who has access to the local system can still access Loki and Prometheus without TLS authentication. But, since these services doesn't support TLS yet, this is the best we can do for now.
Set up Grafana
Grafana can live on its own VM or with Loki and Prometheus.
In this section we'll install Grafana and configure its server TLS, for accessing its dashboard.
You can set up Grafana on the same host as Loki and Prometheus, or on its own host.
Install it
Install Grafana using the OSS release instructions on grafana.com.
Once it's installed, you should see that there's a systemd service calledgrafana-server.service:
$ sudo systemctl daemon-reload $ sudo systemctl enable --now grafana-server $ sudo systemctl status grafana-server ● grafana-server.service - Grafana instance Loaded: loaded (/lib/systemd/system/grafana-server.service; enabled; vendor preset: enabled) Active: active (running) since Wed 2021-04-28 10:36:37 PDT; 6h ago Docs: http://docs.grafana.org Main PID: 791 (grafana-server) Tasks: 18 (limit: 38081) Memory: 71.4M CGroup: /system.slice/grafana-server.service └─791 /usr/sbin/grafana-server --config=/etc/grafana/grafana.ini --pidfile=/var/run/grafana/grafana-server.pid --packaging=deb cfg:default.paths.logs=/var/log/grafana cfg:default.pa> Apr 28 10:36:37 nuc grafana-server[791]: {"@level":"debug","@message":"datasource: registering query type handler","@timestamp":"2021-04-28T10:36:37.349092-07:00","queryType":"node_graph"} ...
Configure TLS (server-side)
Now let's get a TLS certificate for Grafana.
You should change the certificate subject and SANs (Subject Alternative Names) as needed. Note that if you use the
--san flag in step ca certificate, you'll have to supply the main DNS name you want to use twice:
Once as a positional parameter for the certificate subject, and again with a --san flag.
With our certificate in hand, let's enable TLS in Grafana.
Set the following values in the Grafana config (/etc/grafana/grafana.ini):
Now restart Grafana with
systemctl restart grafana-server and you should be able to sign in at https://grafana.internal:3000 (admin is the default username and password) and change your password.
Automate Certificate Renewal (server-side)
Runsudo systemctl edit cert-renewer@grafana-server.service and add the following:
Now we'll enable the timer:
That's all for host setup.
Configure TLS (client-side)
Grafana also needs client certificates for connecting to Prometheus and Loki!
There's no config file for this; these certificates are configured and stored in Grafana's database, and the way to automate deployment is with Grafana's API.
Create an API Key
In the Grafana UI, go to Settings -> API Keys and create an API key for yourself. Use the Role of "Admin", and save it.
Grafana will give you acurl command for testing—but it won't work, you'll get a certificate error at first.
Add --cacert <(step ca root) to the curl command, to get curl to trust your CA, and you should see some output.
Did that work? Great. Hold onto that bearer token.
Create Data Sources
Now let's set up Grafana's data source for Loki.
In this step we'll get a certificate for the data sources, add Loki and Prometheus data source to Grafana, and set up some files that we'll reuse later to automate renewal:
$ cd /etc/grafana $ sudo -E step ca certificate grafana.internal datasource.crt datasource.key --provisioner acme $ sudo mkdir -p /etc/systemd/system/cert-renewer@grafana-datasources.service.d $ cd /etc/systemd/system/cert-renewer@grafana-datasources.service.d $ sudo tee loki_datasource.jq > /dev/null <<'EOF' { "name": "Loki", "type": "loki", "access": "proxy", "url": "https://loki.internal:3101", "jsonData": { "tlsAuth": true, "tlsAuthWithCACert": true }, "secureJsonData": { "tlsCACert": $ca_cert, "tlsClientCert": $client_cert, "tlsClientKey": $client_key }, } EOF $ sudo tee api_headers > /dev/null <<'EOF' Content-Type: application/json Authorization: Bearer eyJrIj...CJpZCI6MX0= EOF $ sudo jq -n \ --rawfile ca_cert $(step path)/certs/root_ca.crt \ --rawfile client_cert /etc/grafana/datasource.crt \ --rawfile client_key /etc/grafana/datasource.key \ -f loki_datasource.jq | curl -sS -X POST \ -H @api_headers \ -d @- \ --cacert $(step path)/certs/root_ca.crt \ https://grafana.internal:3000/api/datasources
Change the URLs and bearer token to fit your setup.
jq does the heavy lifting here:
- Templating for the POST data
- When the certs are injected into the template,
jqwill convert newlines to\nbecause that’s what JSON needs - Certs are nicely pulled into
jqvariables from files using bash sugar
I wrote a story about how I arrived at the fancy command string above (jq | curl) in another post: How to Handle Secrets on the Command Line.
We'll reuse this pattern in the certificate renewer service.
And for Prometheus:
$ cd /etc/systemd/system/cert-renewer@grafana-datasources.service.d $ sudo tee prometheus_datasource.jq > /dev/null <<'EOF' { "name": "Prometheus", "type": "prometheus", "access": "proxy", "url": "https://prometheus.internal:9091", "jsonData": { "tlsAuth": true, "tlsAuthWithCACert": true }, "secureJsonData": { "tlsCACert": $ca_cert, "tlsClientCert": $client_cert, "tlsClientKey": $client_key }, } EOF $ sudo jq -n \ --rawfile ca_cert $(step path)/certs/root_ca.crt \ --rawfile client_cert /etc/grafana/datasource.crt \ --rawfile client_key /etc/grafana/datasource.key \ -f prometheus_datasource.jq | curl -sS -X POST \ -H @api_headers \ -d @- \ --cacert $(step path)/certs/root_ca.crt \ https://grafana.internal:3000/api/datasources
Automate Certificate Renewal (client-side)
To automate client cert renewal in a running Grafana instance, we already have most of what we need. We just need a renewer service that edits the datasources we just created.
Runsudo systemctl edit cert-renewer@grafana-datasources.service and add the following:
Now we'll enable the timer:
You're done!
Did you make it this far? Everything should be up and running at this point.
Here are some next steps:
-
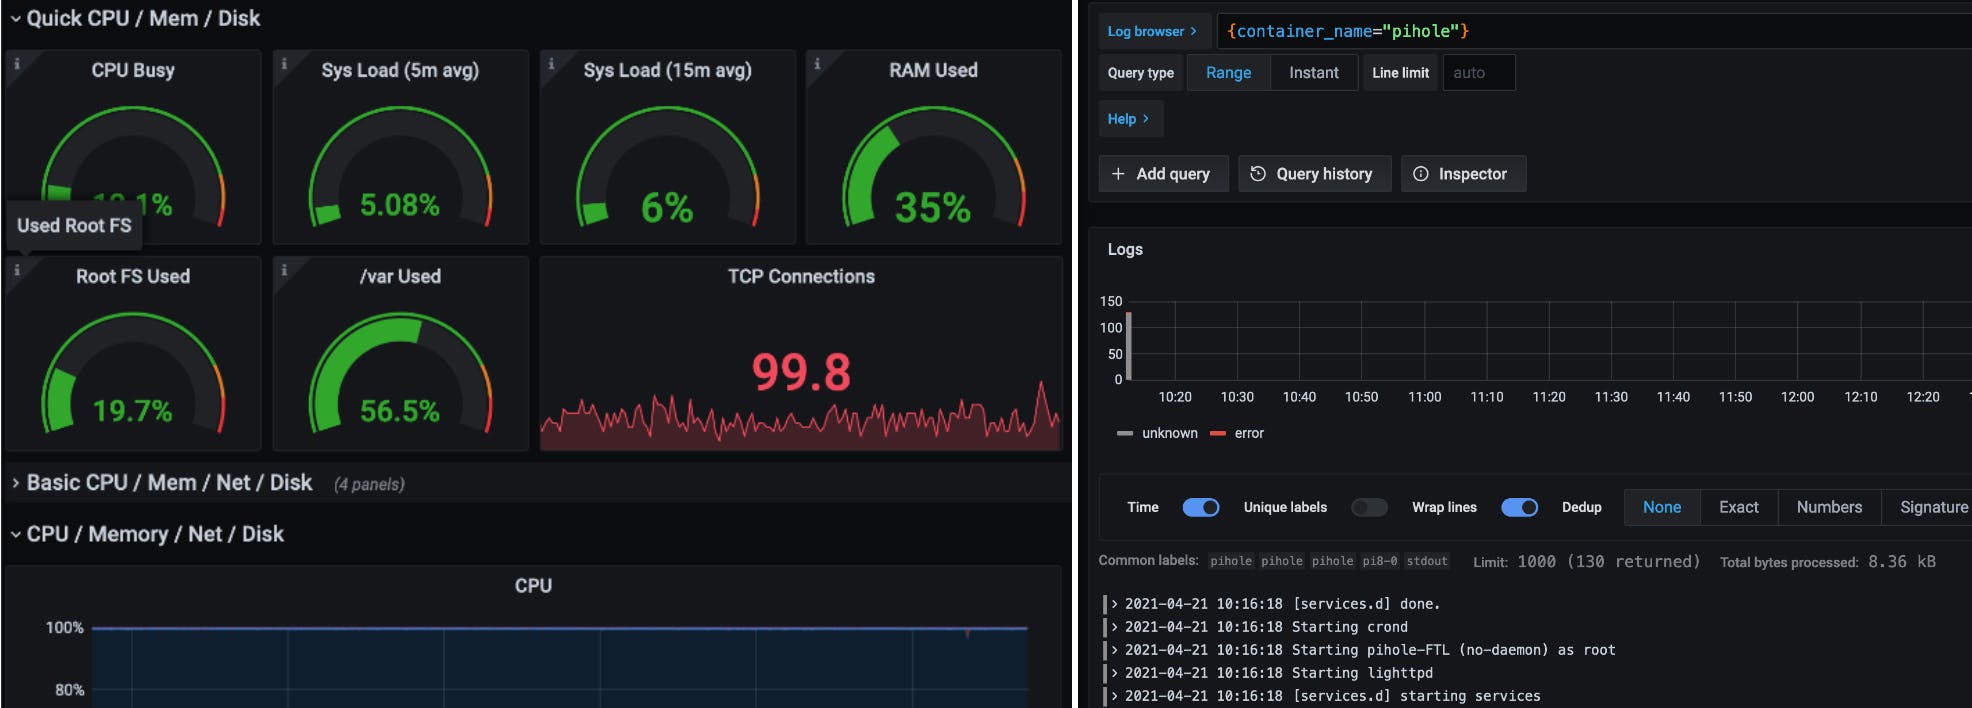
Add the node_exporter dashboard
In Grafana, import the node_exporter dashboard. Go to Dashboards -> Manage, choose Import, and enter "1860" in the ID. You'll get a nice dashboard for node_exporter!
-
Browser your Loki logs
Go to the Explore tab in Grafana. The Log browser tab is the best way to get started with LogQL, the query language for Loki.
-
Add an alerting notification channel
Go to Alerts -> Notification Channels and you can configure an integration there. There are many supported notifiers. Once you've got a notification channel set up, you can create alerts in Grafana.
Wrapping Up
Wow. It's a lot of setup, right?
These services are not trivial to set up in the first place. Add mutual TLS, certificate automation and deployment... it's a lot! Even with an ACMEstep-ca, the step CLI tool, and our certificate renewer service.
Unfortunately, every service has a slightly different TLS configuration.
At Smallstep, we aim to make mutual TLS a lot easier to use for everyone, and that includes this sort of automation. As we continue to write tutorials and learn how TLS is really used out in the world, we're improving our tools so that mutual TLS between services can become a default—not an afterthought.
Subscribe to updates
Unsubscribe anytime, see Privacy Policy
Carl Tashian (Website, LinkedIn) is an engineer, writer, exec coach, and startup all-rounder. He's currently an Offroad Engineer at Smallstep. He co-founded and built the engineering team at Trove, and he wrote the code that opens your Zipcar. He lives in San Francisco with his wife Siobhan and he loves to play the modular synthesizer 🎛️🎚️